Was your state warmer or cooler than usual over summer?
The full stats for the 2022/23 summer are in, and Australia as a whole was marginally warmer than usual, while summer was slightly warmer than the long-term average in four states and slightly cooler in the other three.
We'll break our summery summary into three parts, taking a quick look at temperatures, rainfall, and then extremes.
Temperatures
Below is the table of temperatures for the country as a whole and for each state. The figures show the anomaly (the difference from the long-term average in °C).
- AUS Max temp +0.04 Min temp +0.09 Overall +0.07
- QLD Max temp −0.49 Min temp +0.07 Overall −0.21
- NSW Max temp +0.29 Min temp −0.61 Overall −0.16
- VIC Max temp +0.08 Min temp +0.27 Overall +0.18
- TAS Max temp +1.08 Min temp +0.51 Overall +0.79
- SA Max temp +0.93 Min temp +0.61 Overall +0.78
- WA Max temp +0.66 Min temp +0.27 Overall +0.47
- NT Max temp −1.32 Min temp −0.22 Overall −0.76
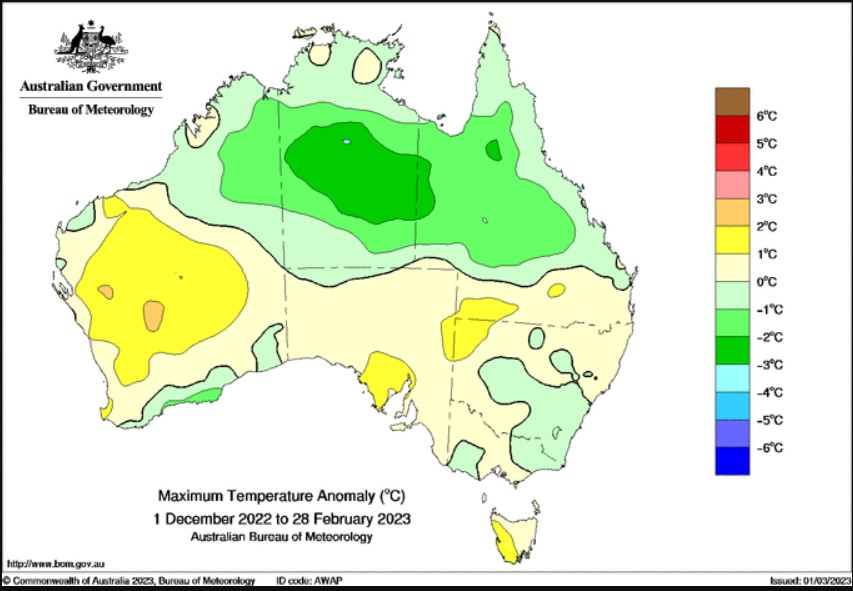
You can see the data represented graphically below, with large patches of green for the three states (NSW, NT, Qld) where the overall (mean) temperature was lower than usual.

Image: Interestingly, Tasmania was the only state that was warmer than usual as a whole. Source: BoM.
Rainfall
In terms of summer, rainfall, Australia as a whole was 27% above the long-term average.
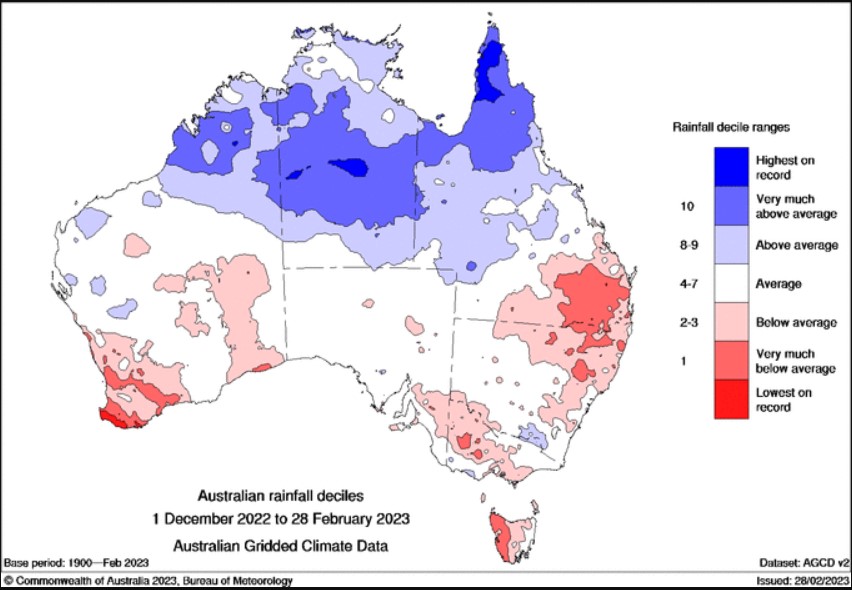
The rainfall stats tell the story of a strong wet season in most parts of the north, but declining rainfall in the south as La Niña started to wane.
- AUSTRALIA +27%
- Queensland +33%
- New South Wales −35%
- Victoria −22%
- Tasmania −31%
- South Australia −23%
- Western Australia +19%
- Northern Territory +58%
Again, here's a visual representation of the above.

Extremes
Australia equalled its lowest summer temp on record in the 2022/23 summer, and came within 1.4°C of its hottest temperature ever recorded.
- Hottest max 49.3°C at Onslow Airport (WA) on Jan 14
- Coldest max -0.2°C at Thredbo Top Station (NSW) on Dec 14
- Coldest min -7.0°C at Perisher Valley (NSW) on Dec 9
- Warmest min 34.3°C at Marble Bar (WA) on Dec 12
- Wettest day 316.6 mm at Proserpine Airport (Qld) on Jan 16
Please note:
- ACT data is included as part of NSW for all monthly and seasonal summaries.
- When we speak of the "long-term average", we refer to the 1961–1990 average, which is the current international standard period for the calculation of climate averages used by bodies like the BoM and the World Meteorological Organization. More info here.