La Nina not as cool as it used to be
Our planet just had one of its three warmest years on record, despite the cooling influence of La Niña in the last few months.
Preliminary data suggests that 2020 will be one of Earth's three warmest years on record. This achievement will also close the lid on our planet's warmest decade on record (2011-2020).
But while these feats are both exceptional on their own, one of the big stories hidden in the data is that 2020 was still exceptionally warm despite the presence of La Niña towards the end of the year.
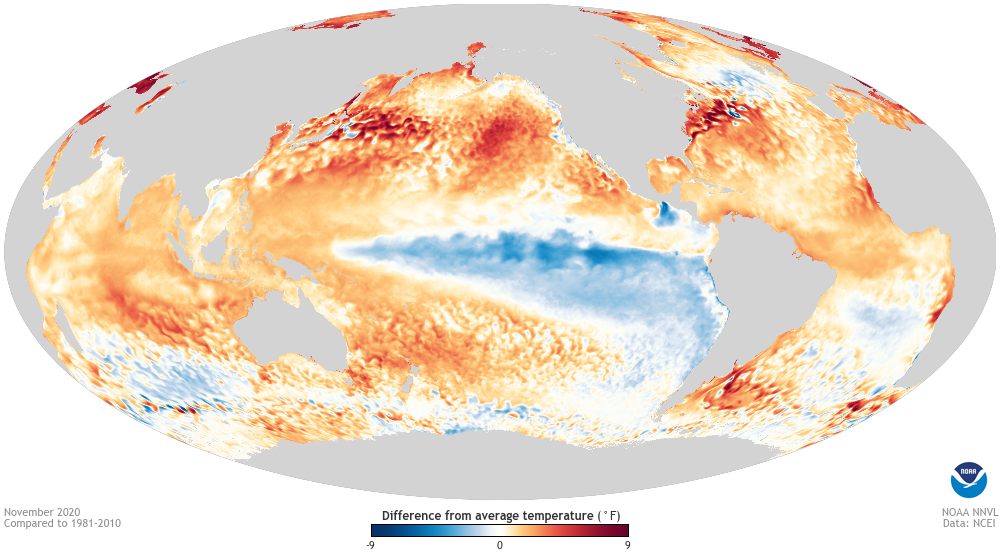
La Niña refers to a pattern of unusually cool sea surface temperatures and abnormally strong trade winds across the equatorial Pacific Ocean. Because La Niña is associated with cooling over a vast area of the Pacific Ocean, it helps lower the planet's average surface temperature relative to non-La Niña years.

Image: Global sea surface temperature anomaly during November 2020. Source: NOAA NCEI
More often than not, the coolest year in any given decade occurs during a La Niña year and the warmest is typically underpinned by its counterpart, El Niño.
So, when looking back at our planet's annual global surface temperatures since 1880, it's remarkable for 2020 to find a spot on the podium while being affected by La Niña.
This feat reveals how cycles of natural climate variability such as La Niña and El Niño are operating against the tide of rising global surface temperature.
We can compare how much warmer or cooler the planet was during past La Niña events by comparing them all to the average global surface temperature of the 20th century.
Back in the 1970's, a strong and prolonged back-to-back La Niña event occurred between 1973 and 1976. This period included Australia's wettest year on record in 1974. During these four years, the global average surface temperature was between 0.07ºC below and 0.19ºC above the 20th century average.
Another lengthy La Niña period occurred between 1998 and 2001. These years produced global surface temperatures ranging from 0.42 to 0.65ºC above the 20th century average.

Image: The lines in this graph show the global surface temperature anomalies for each month between January 1950 and November 2020. La Niña periods are shaded blue and El Niño periods are red. You can see that La Niña periods are typically relatively cooler than surrounding periods, and that there is an overall warming trend in the timeseries. Source: NOAA NCEI
Fast forward to the last notable La Niña event that occurred between 2010 and 2012. The average global surface temperature during this La Niña event ranged from 0.64 and 0.73ºC above the 20th century average.
This year, the global surface temperature will most likely come in above 0.9ºC above the 20th century average. It's worth mentioning that the current La Niña is not as strong as the 2010-12 event.
While La Niña still exerts a cooling influence on our planet's global surface temperature, it's not enough to counteract the observed rate of global warming. La Niña just isn't as cool as it used to be.