Australia's temperature fingerprints
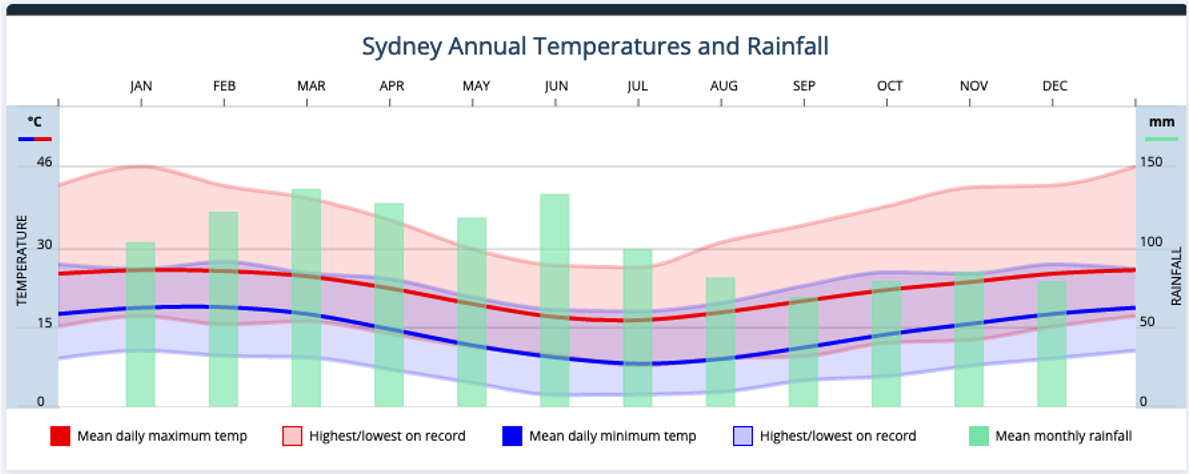
Chances are you’ve come across what an annual climate graph looks like. It tells you all you need to know about a location – how cold can it get, how hot could it be, how much rain will there be in the month you’re travelling there (Fig. 1). It’s typically what you’d consider looking at if you’re planning a trip to a new place, right?

Figure 1: Annual temperature and rainfall data by month for Sydney, Australia (Weatherzone, 2023).
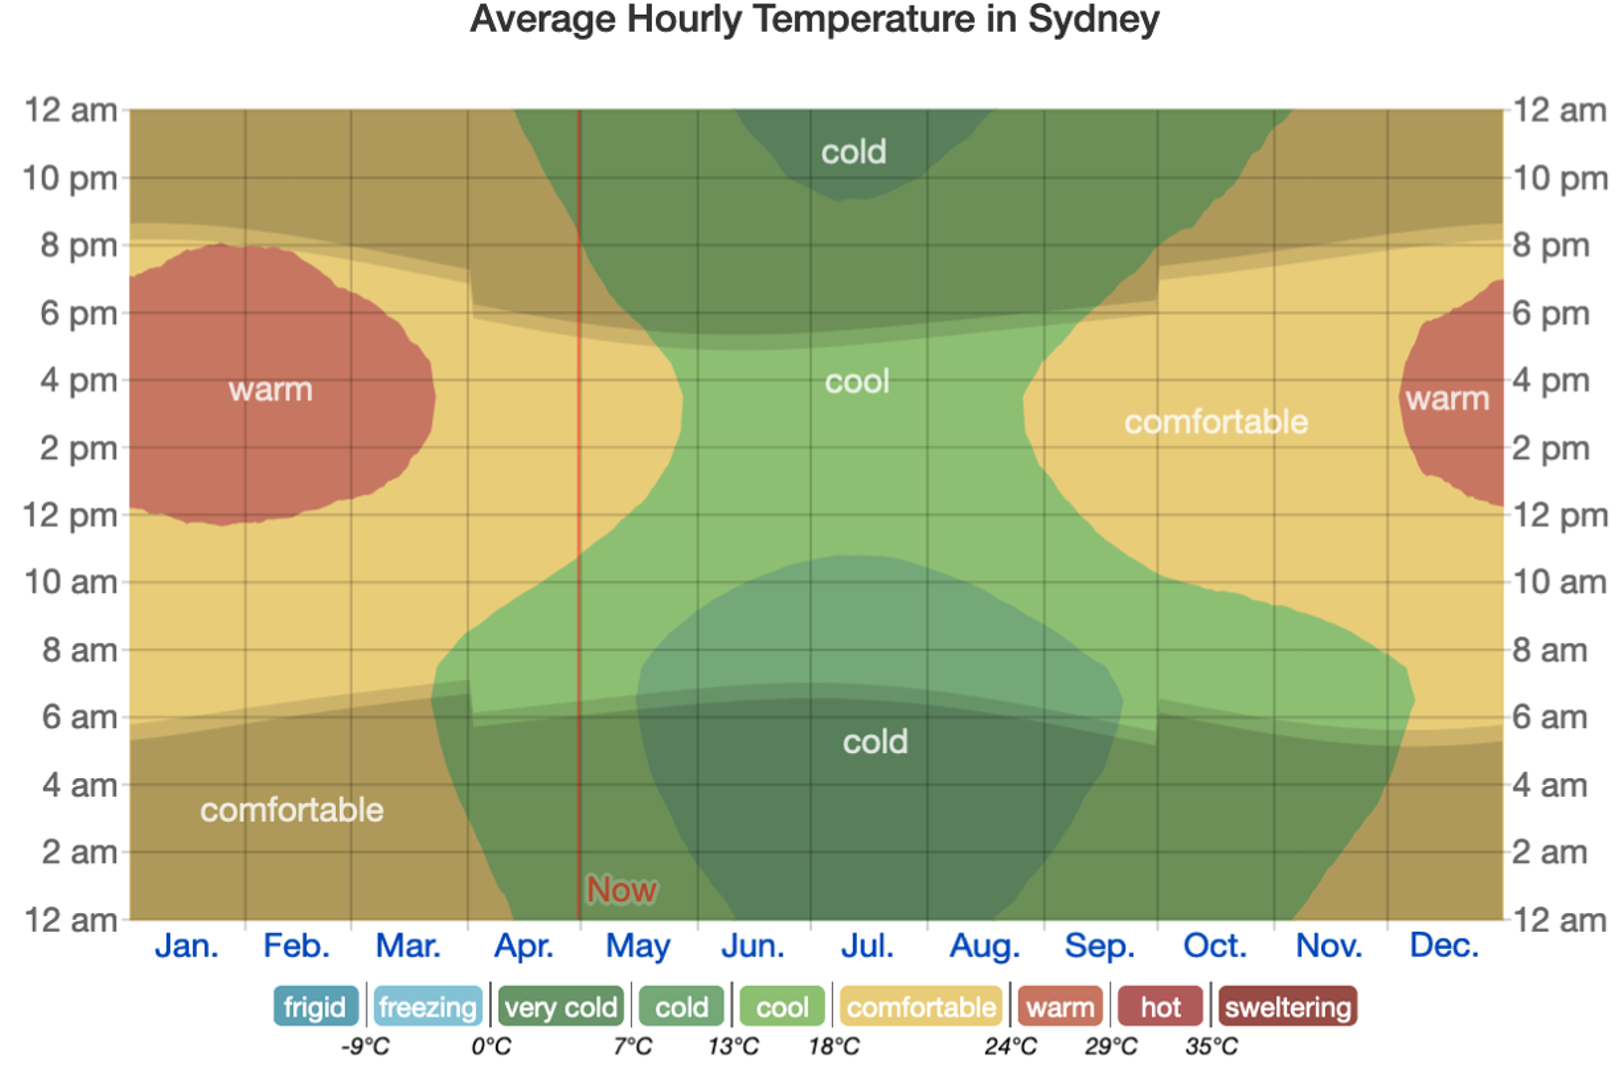
But have you ever heard of a temperature fingerprint? Sounds a bit like a crime scene.... You may be surprised to know that this could be a more readable annual temperature graph. Take a look at Figure 2.

Figure 2: Sydney's temperature fingerprint (Weather Spark, 2023).
Don’t get too overwhelmed – there's a lot going on. How can one graph show so much information? Let’s look at one component at a time.
Bright colours are everywhere! These colours are matched to so-called ‘comfort levels’ that are defined by the temperatures in the key. How’s that for a personalised climate outlook on a city? Of course, there may be some differing opinions on this scale. What’s comfortable for some may be hot for others. But never fear – let the numbers guide you here.
Similar to the conventional climate graph, the months are spread out horizontally, such that the start of the year is on the left and the end of the year is on the right. However, with this new fingerprint, we can pinpoint any time throughout the year thanks to the time increasing vertically.
And as if that wasn’t enough, to top it off, you’ve got the daylight hours in the shading. Dark shading (towards the upper and lower parts of the fingerprint) represents when the sun is down, whereas the light shading (in the middle of the graph) represents when the sun is up. You can even see the step in the shading when daylight savings starts and ends! A world awaits you for discovery on what things could look like in polar or tropical regions.
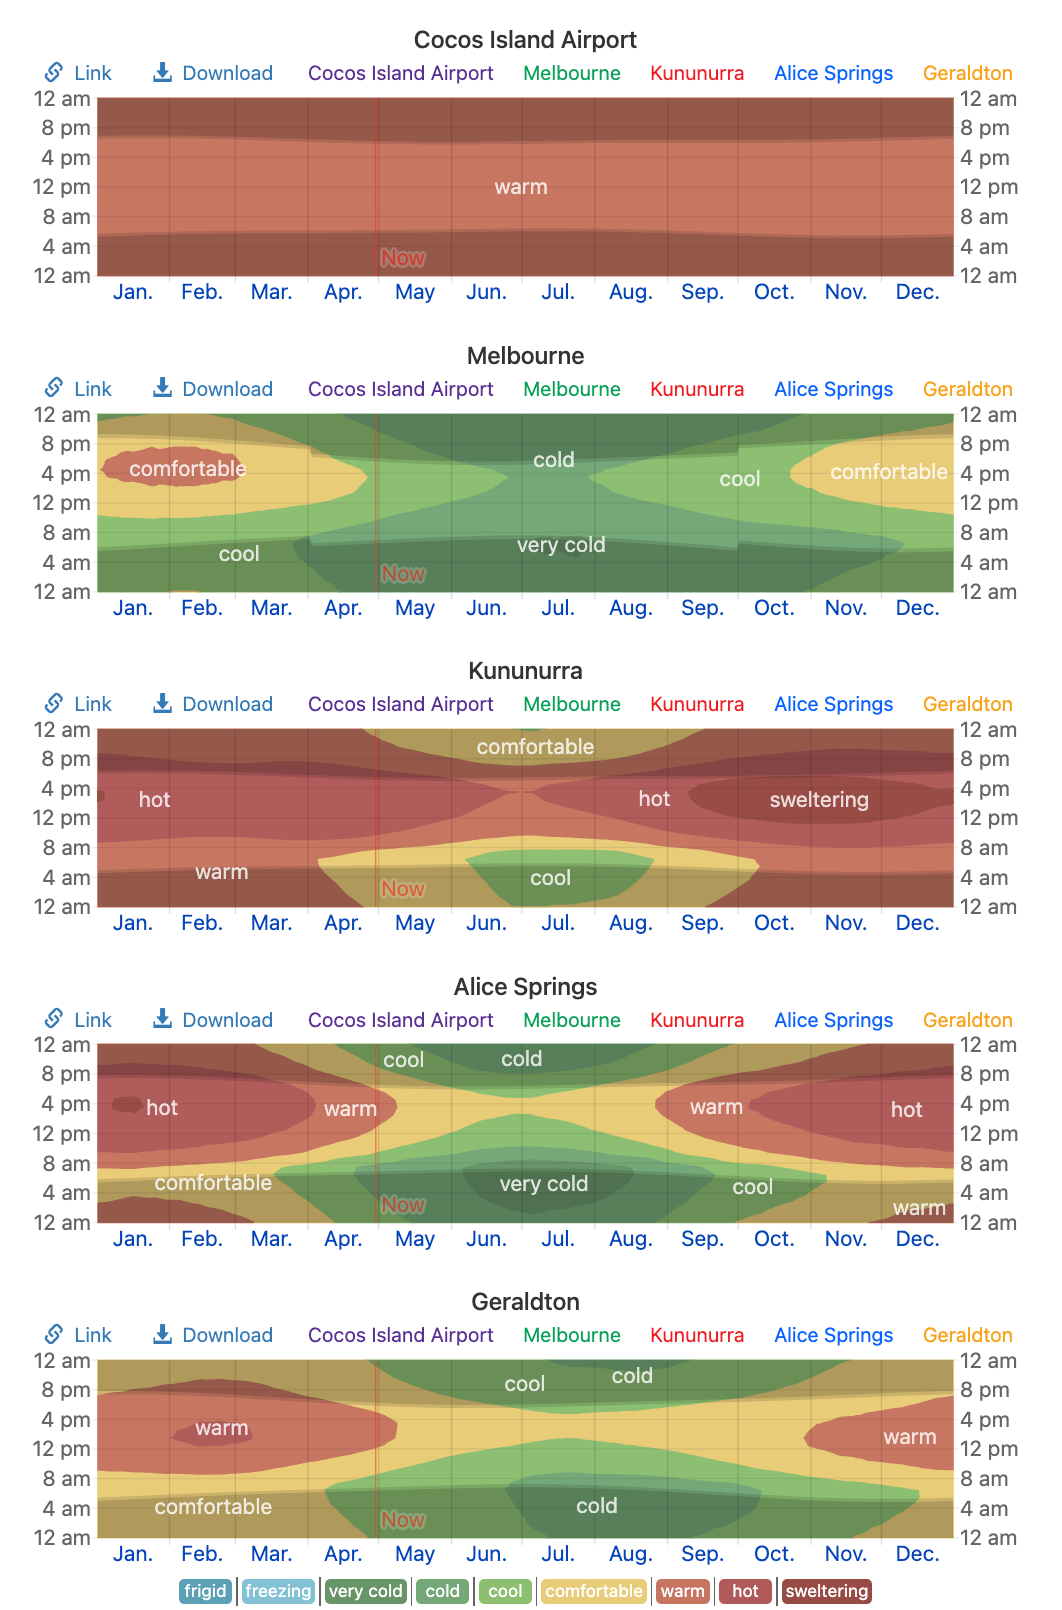
So it seems that fingerprints really can tell us a lot about a scene (crime, or clime). Take a look at the fingerprints spread around the country (Fig. 3), and have a think about what contributes to what they look like. Be a detective!

Figure 3: Temperature fingerprints of various places around Australia (Weather Spark, 2023).
To check out global temperature fingerprints, visit https://weatherspark.com/.