
Australia's second-warmest January on record
Australia has recorded its second-warmest January on record, with average temperatures that were 2.15°C above the long-term average across the nation as a whole.
Only January 2019 was warmer overall, with temps a whopping 2.85°C above the long-term average in what became Australia's warmest year on record.
But January 2025 was still an exceptionally warm month, with every state and territory warmer than usual, while Western Australia endured its warmest January on record.
Here's the state-by-state breakdown of January’s mean temperature anomalies (mean temps are the average of max and min temps).
- South Australia +2.52°C
- Queensland +2.16°C
- Northern Territory +2.14°C
- Western Australia +2.13°C
- New South Wales* +2.02°C
- Victoria +1.71°C
- Tasmania +0.85°C
*Note that the ACT is included as part of NSW as it has too few sites for a meaningful territory-wide average.
In terms of rainfall, January was relatively dry compared to the long-term norm. Rainfall was 33% down on the long-term average nationwide, and was below-average in all states overall, although some pockets of some states got a heavier soaking than usual.

Image: Cyclone Sean gave WA’s Pilbara coast considerably more January rainfall than usual, while the NSW coast was reasonably wet too, though thankfully not in the first week of the year when the men's cricket Test was on at the Sydney Cricket Ground. Source: BoM.
When rainfall is below average, that generally means skies have been clear, which in turn tends to point towards warmer weather. So Australia's dryish January partly explains the exceptionally warm temperatures nationwide.
But the underlying influence of climate change must also be taken into consideration, as illustrated in the graph below.
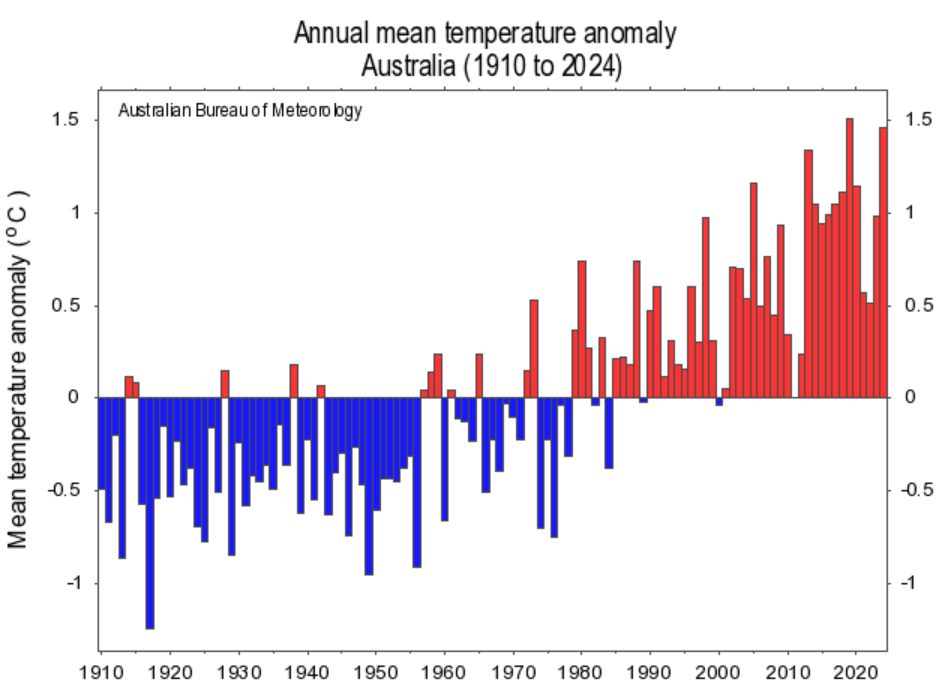
Image: The warming trend is unmistakable. Source: BoM.