
14 years since eastern Australia turned red
It’s been exactly 14 years since Mars-like apocalyptic scenes startled Australians across the east at the end of what was described as a 'dry and exceptionally mild' winter.
It all started on September 22nd, 2009, when a deep low-pressure system & cold front over the Bight tracked northeast and positioned itself bang over South Australia’s Eyre Peninsula, shown in Figure 1.
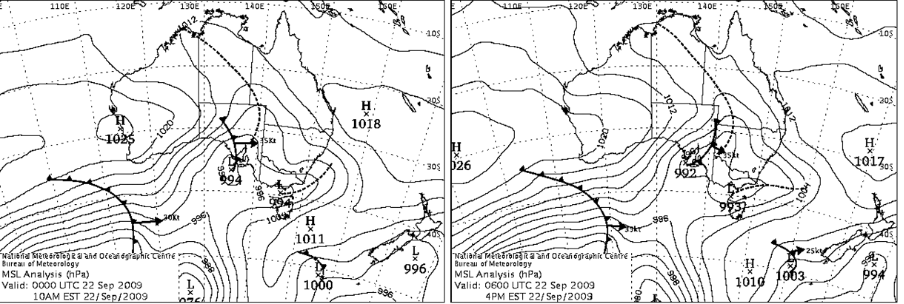
Figure 1: The deep low-pressure system over South Australia. Images taken 6 hours apart (10am EST 22nd & 4pm EST 22nd). The low-pressure system deepened from 994hPa to 992hPa in this time (Bureau of Meteorology, 2009).
To help encapsulate what monstrosity of a system can kick up that much dust, picture a hammer thrower. The more you bend your knees, the more grounded and stable you become, so the faster you're able to propel your hammer.

Figure: A hammer thrower propelling a hammer, just as the low-pressure system propelled the front.
The low-pressure system remained stubbornly centred over South Australia's south coast for about six hours, effectively 'hammer-throwing' its associated cold front across the southern interior. Over the span of six hours, the system deepened from 994hPa to 992hPa (the equivalent of 'bending its knees'), with extreme surface winds picking up rapidly, as with the hammer propulsion.
This was only the beginning. By about 4pm that afternoon, Broken Hill was covered in red dust.
The system began to track further east, deepening as it went, continuing to send dry gusty winds and dust over New South Wales, overnight and into the morning of September 23rd.
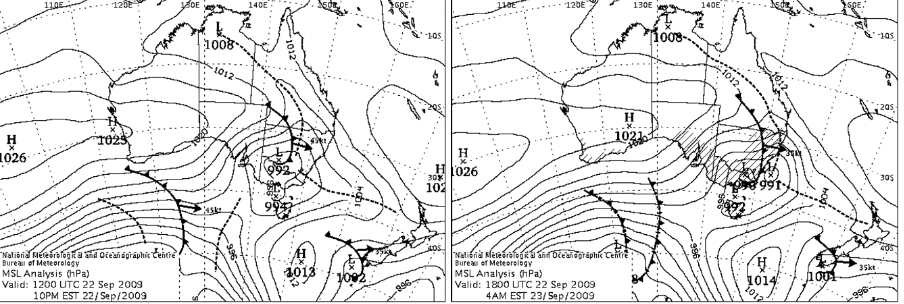
Figure 2: The deep low-pressure system moving east over New South Wales. Images taken 6 hours apart (10pm EST 22nd & 4am EST 23rd). The low-pressure system deepened from 992hPa to 990hPa in this time (Bureau of Meteorology, 2009).
Some of the strongest winds occurred overnight, reaching 100km/h and accumulating dust. Around 12 million people across Queensland, New South Wales and the ACT woke up to some form of impacted visibility, with winds continuing to blow as the front moved off the coast.
The most severe visibility impact was in Sydney, with 18 international flights being forced to divert to Melbourne or Brisbane during the morning. Several flights from New Zealand also were forced to turn back to their origin after being unable to land at Sydney Airport. Particulate matter in the air was also over 700 times greater than that of a normal day.
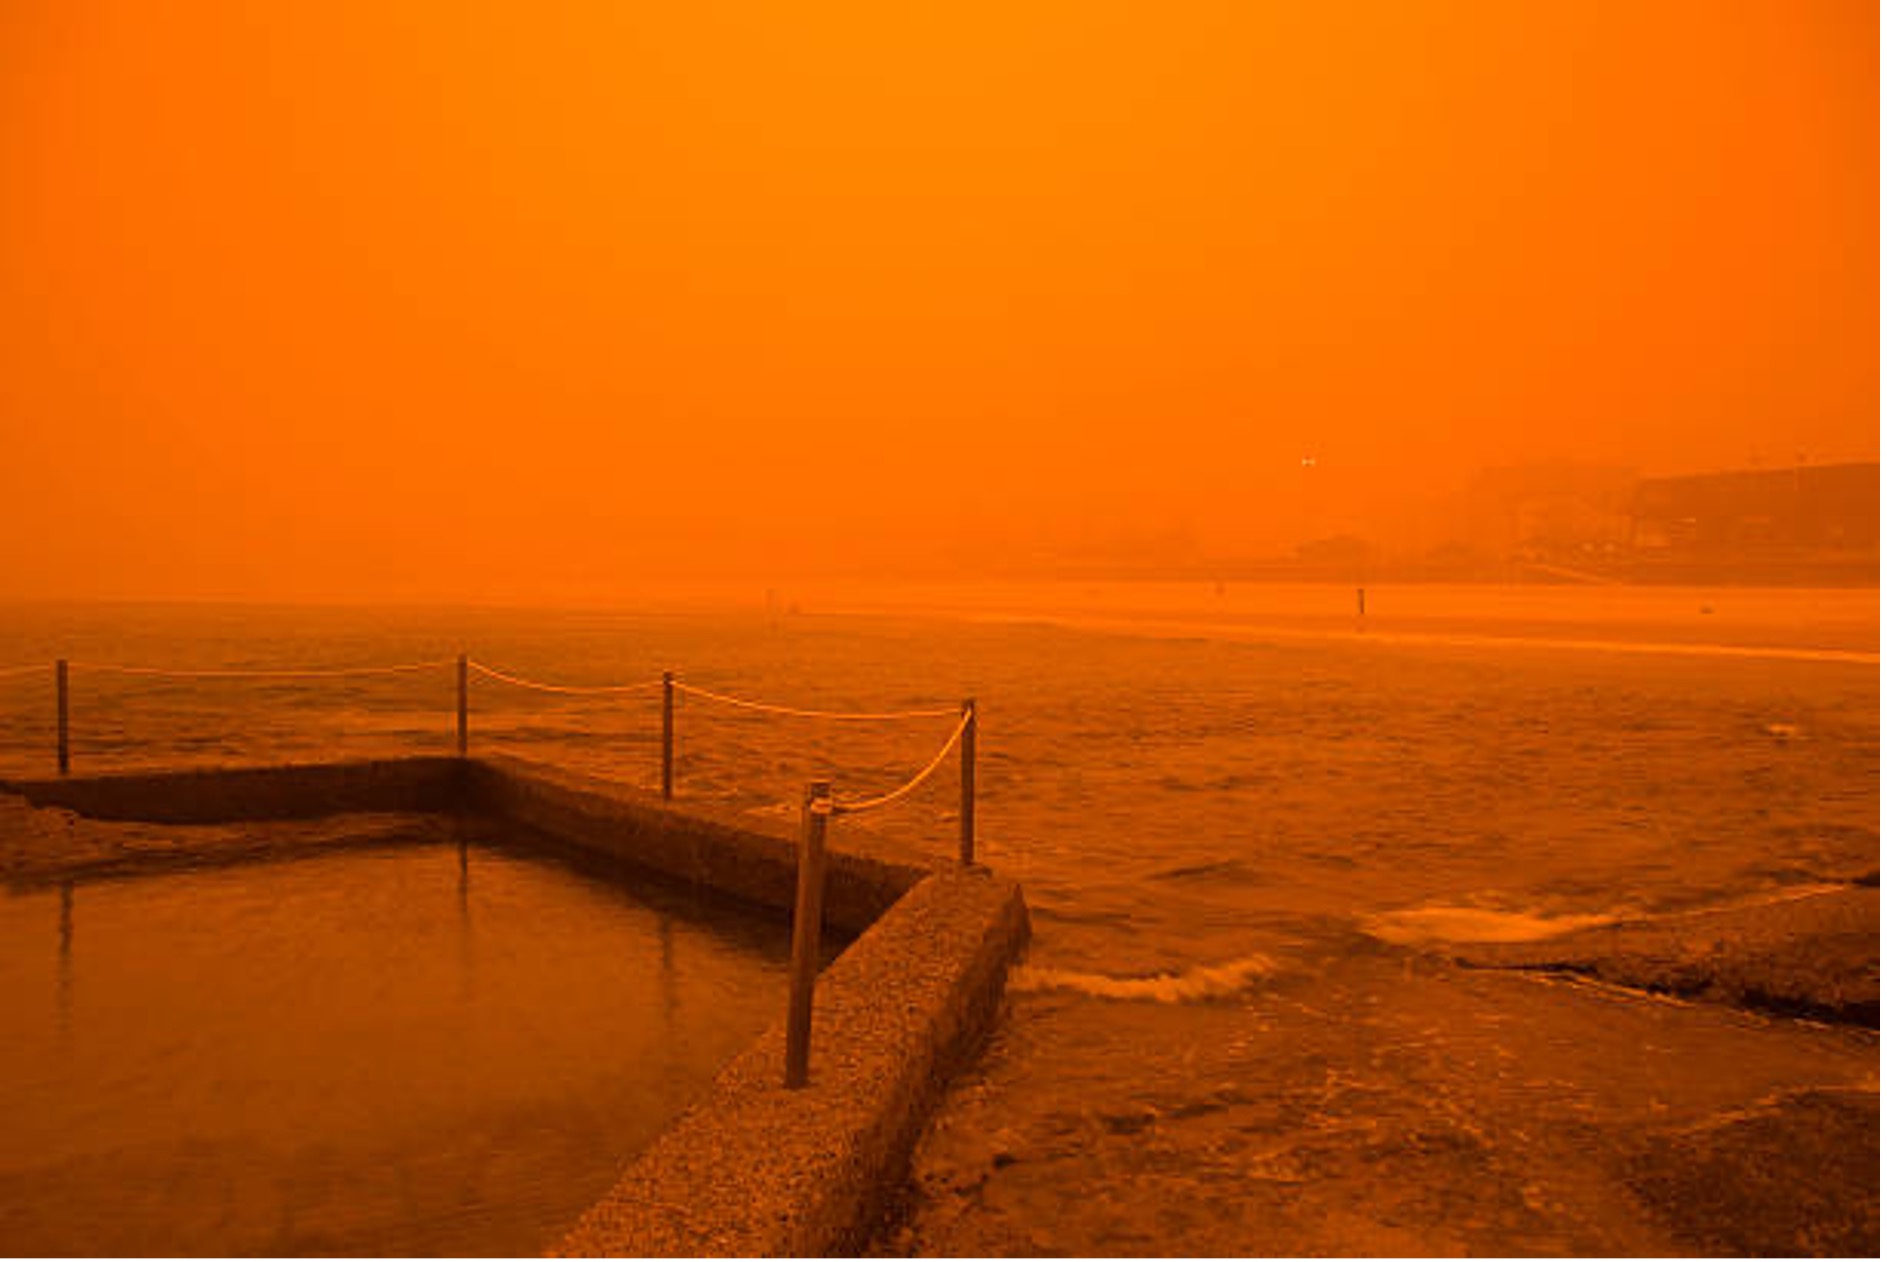
Figure: View by the water in Sydney during the peak of the dust storm, September 23, 2009.
This event was by no means out of nowhere. At the time, there was a strengthening of an El Niño phase, a negative Indian Ocean Dipole, and most notably a negative Southern Annular Mode (SAM). Figure 3 shows the fluctuation of the SAM using the Antarctic Oscillation (AAO) Index. In September 2009, the SAM was negative, which encouraged the northward tracking of the passage of cold fronts and enhanced airflow from the interior.
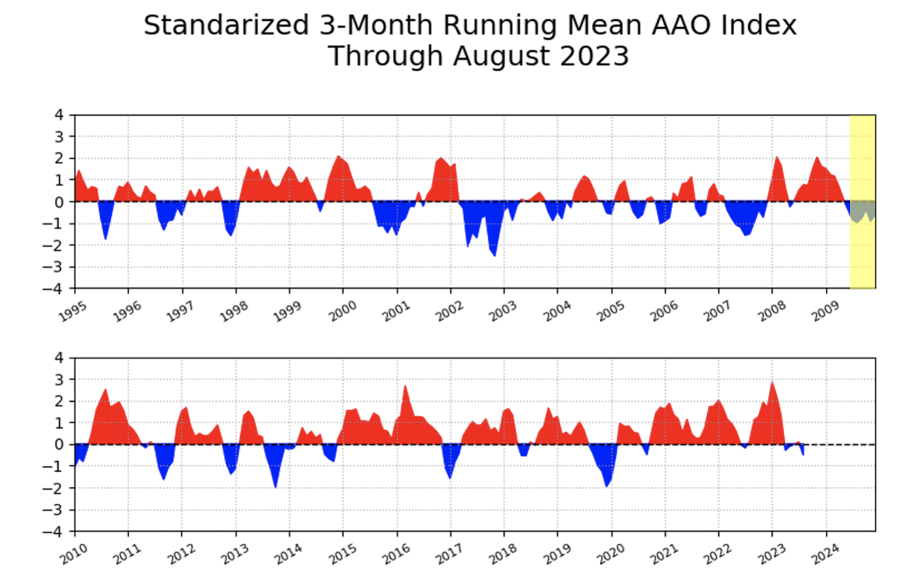
Figure 3: Antarctic Oscillation (AAO) index since 1995 using 3-monthly running mean values. During mid 2009 (highlighted) the running mean indicated a negative SAM, which encourages interior dry air flow in winter and a northward propagation of the passage of cold fronts (NOAA, 2023).
The strength of the cold front is not always surface-driven. Figure 4 shows an anomalous low-pressure trough at the upper levels (500hPa, about 5.5km above the surface), which helped drive the strong front at the lower levels.
Figure 4: 500hPa geopotential height on the morning of September 22nd, 2009. The 'bell-curve' over South Australia shows 'upper-level' low pressure anomalies and is largely responsible for the strong surface system that brought about the dust to eastern Australia (Bureau of Meteorology, 2009).
Various factors with specific timings contributed to the buildup of this major dust storm, coined the worst in New South Wales in nearly 70 years. It's not often that cold fronts pass through the nation's interior; they tend to slide to the south over the Bight. When they do pass over the interior, there's always the potential for plenty of dust to be kicked up. Keep an eye on forecast charts with cold fronts as well as the Southern Annular Mode fluctuations here to keep well prepared for rust-red dustings.