


There are no active warnings for this location.
Rain Radar
Light
Heavy
Daily Forecast
Live Extremes
Warnings
Map Layers
Daily Forecast
Rain & storms are spreading across already-flooded Qld & northern NSW as moisture feeds a trough. A low in the east is maintaining hazardous surf on the NSW coast. A high is clearing southern NSW, Vic, Tas, SA & southern NT. A front is bringing cool winds to southern WA.
Weather Maps
Daily Forecast
Rain & storms are spreading across already-flooded Qld & northern NSW as moisture feeds a trough. A low in the east is maintaining hazardous surf on the NSW coast. A high is clearing southern NSW, Vic, Tas, SA & southern NT. A front is bringing cool winds to southern WA.
Latest Warnings
AUS
Extremes
Live Extremes
Highest Temp
32.8°C (7:50PM AWST)
Apr Long Term Average: 33.8°C
Apr Record: 41.6°C (2016)
Lowest Temp
2.0°C (10:50PM AEDT)
Apr Long Term Average: 1.4°C
Apr Record: -7.2°C (2019)
Today’s Extremes
Highest Temp
40.5°C (2:39PM AWST)
APR Long Term Average: 28.9°C
APR Record: 40.1°C (2021)
Lowest Temp
-2.3°C (4:21AM AEDT)
APR Long Term Average: 1.4°C
APR Record: -7.2°C (2019)
This Month’s Extremes
Highest Temp
40.5°C (2 April)
Apr Long Term Average: 28.9°C
Apr Record: 40.1°C (2021)
Lowest Temp
-49.9°C (1 April)
Apr Long Term Average: 10.7°C
Apr Record: -1.2°C (2006)
This Year’s Extremes
Lowest Temp
-49.9°C (31 March)
JAN Long Term Average: 17.1°C
JAN Record: 6.1°C (1972)
Latest News

Climate Updates


Latest News

Today, 5:52AM UTC
How a West Australian cyclone saturated Queensland
Heavy rain and flood warnings are in the news again today in Queensland – including in Brisbane and the heavily populated southeast corner of the state – due to the remnants of Tropical Cyclone Dianne. Dianne made landfall on WA's Kimberley coastline on Saturday morning. So how is it responsible for soaking parts of Queensland and even northern NSW several days later – when some of those areas are as far as 3000 kilometres from the Kimberley? The answer is that the remnant moisture from TC Dianne was picked up by the subtropical jet stream and rapidly transported towards Queensland, via Central Australia. The 4-hour loop below shows moisture streaming across the country associated with the remnants of the former cyclone on Monday. Image: Combined Australian satellite and radar loop between 1pm and 5pm (AEST) on Monday March 31, 2025. Monday was the day when many outback localities received significant rainfall from this system, including Alice Springs with 50.8mm in the 24 hours to 9am Monday. The rain would have been welcome, as Alice Springs missed out on last week's deluge that soaked large parts of outback and central Qld, as well as parts of outback SA and NSW. Indeed the 50.8mm that Alice Springs received this Monday was more rain in a single day than the town had received over the course of any entire month going back 12 months. By Tuesday, Central Queensland was getting yet another soaking, with 24-hour totals of 100mm at multiple locations, and by Wednesday morning, rain had spread all the way to southeast Qld and northeast NSW, with Brisbane receiving 34.6mm between 9am and 3:30pm (AEST) Wednesday. Image: Combined Australian satellite and radar loop around the middle of the day on Wednesday, April 2, 2025. Most of the moisture from ex-TC Dianne should have completed its trans-continental journey and moved offshore by Thursday, although showers remain likely in many parts of Queensland on Thursday and Friday, as the trough across central and northern parts of the state lingers. Western and interior Queensland should return to much drier conditions from the weekend onwards.
Today, 12:28AM UTC
Damaging surf battering NSW coast
A powerful swell produced by a bombing low pressure system over the Tasman Sea is causing damaging surf and erosion along the NSW coast today, including parts of Sydney. The video below shows the Tasman Low spinning around 800km off the NSW coast on Tuesday. Video: Satellite images showing a deep Tasman Low on Tuesday, April 1, 2025. This system intensified so rapidly on Monday morning that its central pressure dropped by 20hPa in 24 hours. At this latitude, this was enough for it to be classified as a ‘bomb cyclone’, which is a term used by meteorologists to describe low pressure systems outside the tropics that intensify rapidly over a short period of time (a process called explosive cyclogenesis). The powerful Tasman Low has caused ferocious winds that have been whipping up massive waves across the Tasman Sea in the last couple of days. On Monday night, sensors attached to a satellite passing over the Tasman Sea detected a 400km swathe of winds blowing at more than 50 knots (93 km/h) on the western and southern sides of the low’s centre. Satellite data also showed that wave heights on Tuesday morning reached 9.6 metres near this region of storm force winds. Image: Satellite-detected wind speeds on Monday night. The wind bards with small triangles on their tails show a huge region of winds blowing at more than 50kt (93km/h). Source: NOAA/NESDIS Closer to Australia’s east coast, significant wave heights of around six metres were also observed near Eden and Port Kembla on Tuesday and Wednesday morning. These big waves have been causing erosion and damage at some beaches along the NSW coast. In Sydney, Tuesday night’s high tide combined with the pumping surf to cause damage at popular beaches including Bondi and Bronte. As the sun rose on Wednesday, beachside walkways were covered with sand, walls had been knocked over and the famous Bondi Icebergs pool area had even suffered damage. Image: A damaged wall at Bronte on Wednesday morning. Source: Krisha Patel While swell will gradually ease along the NSW coast in the coming days, a hazardous surf warning remains in place on Wednesday for the coast stretching from southern NSW to southeast Qld.

01 Apr 2025, 9:20AM UTC
Australia's hottest and 4th-wettest March on record
With nationwide average temperatures that were 2.41°C above the long-term average, Australia has registered its hottest March since national records were first kept in 1910. It was also Australia’s fourth-wettest March on record, with rainfall that was 47% above the long-term average. Wet weather and above-average temperatures generally don’t go together for the obvious reason that cloudy weather restricts the amount of warming sunlight, therefore it’s likely that the underlying influence of climate change was a factor contributing to Australia's very warm March. Image: Mean temperature anomalies for Australia from 1910 to 2025. The anomalies are compared to the average of the 30-year baseline period from 1961-1990. Source: BoM. Temperature statistics for March 2025 As mentioned, Australia as a whole was 2.41°C above the long-term average, the hottest March on record. Each individual state and territory was warmer than normal. Three states had their hottest March on record – SA, NSW and WA. South Australia registered the biggest anomaly of any state or territory, with statewide temperatures that were 3.26°C above the long-term average. Tasmania registered the smallest temperature anomaly, yet it was still the state's 10th-warmest March on record, with temperatures 1.06°C warmer than the long-term average. Rainfall summary for March 2025 As the blue areas on the chart below indicate, virtually the whole of Queensland and large parts of northern NSW saw rainfall that was very much above average, or even the highest on record, in March 2025. Image: Rainfall deciles for March 2025, with the darkest blue representing the highest March rainfall on record. Source: BoM. Overall it was Queensland's 3rd-wettest March on record. The first notable rainfall reading came on March 9, when Brisbane had its wettest day in half a century with 275.2mm recorded due to ex-Tropical Cyclone Alfred. In the middle third of the month, the wettest part of the country was North Queensland, with Townsville recording its heaviest daily rainfall in 27 years when 301.4mm drenched the city in the 24-hours to 9am on March 19. Around the same time of the month, a weather station on the Cardwell Range, about halfway between Cairns and Townsville, recorded a 7-day rainfall total of 1090.8 mm. In the last full week of the month, 24-hour totals of more than 200mm were recorded at weather stations in far western Qld, as a prolonged influx of tropical moisture soaked outback and central Qld and parts of northern NSW. Despite the relentless rainfall in Qld and parts of NSW, March rainfall totals were below average for most of Tasmania, parts of the mainland's south and west, and parts of Arnhem Land in the Northern Territory. READ MORE: Normally dry creek now 60km wide
Climate Updates

01 Apr 2025, 9:20AM UTC
Australia's hottest and 4th-wettest March on record
With nationwide average temperatures that were 2.41°C above the long-term average, Australia has registered its hottest March since national records were first kept in 1910. It was also Australia’s fourth-wettest March on record, with rainfall that was 47% above the long-term average. Wet weather and above-average temperatures generally don’t go together for the obvious reason that cloudy weather restricts the amount of warming sunlight, therefore it’s likely that the underlying influence of climate change was a factor contributing to Australia's very warm March. Image: Mean temperature anomalies for Australia from 1910 to 2025. The anomalies are compared to the average of the 30-year baseline period from 1961-1990. Source: BoM. Temperature statistics for March 2025 As mentioned, Australia as a whole was 2.41°C above the long-term average, the hottest March on record. Each individual state and territory was warmer than normal. Three states had their hottest March on record – SA, NSW and WA. South Australia registered the biggest anomaly of any state or territory, with statewide temperatures that were 3.26°C above the long-term average. Tasmania registered the smallest temperature anomaly, yet it was still the state's 10th-warmest March on record, with temperatures 1.06°C warmer than the long-term average. Rainfall summary for March 2025 As the blue areas on the chart below indicate, virtually the whole of Queensland and large parts of northern NSW saw rainfall that was very much above average, or even the highest on record, in March 2025. Image: Rainfall deciles for March 2025, with the darkest blue representing the highest March rainfall on record. Source: BoM. Overall it was Queensland's 3rd-wettest March on record. The first notable rainfall reading came on March 9, when Brisbane had its wettest day in half a century with 275.2mm recorded due to ex-Tropical Cyclone Alfred. In the middle third of the month, the wettest part of the country was North Queensland, with Townsville recording its heaviest daily rainfall in 27 years when 301.4mm drenched the city in the 24-hours to 9am on March 19. Around the same time of the month, a weather station on the Cardwell Range, about halfway between Cairns and Townsville, recorded a 7-day rainfall total of 1090.8 mm. In the last full week of the month, 24-hour totals of more than 200mm were recorded at weather stations in far western Qld, as a prolonged influx of tropical moisture soaked outback and central Qld and parts of northern NSW. Despite the relentless rainfall in Qld and parts of NSW, March rainfall totals were below average for most of Tasmania, parts of the mainland's south and west, and parts of Arnhem Land in the Northern Territory. READ MORE: Normally dry creek now 60km wide
03 Feb 2025, 6:15AM UTC
Australia's second-warmest January on record
Australia has recorded its second-warmest January on record, with average temperatures that were 2.15°C above the long-term average across the nation as a whole. Only January 2019 was warmer overall, with temps a whopping 2.85°C above the long-term average in what became Australia's warmest year on record. But January 2025 was still an exceptionally warm month, with every state and territory warmer than usual, while Western Australia endured its warmest January on record. Here's the state-by-state breakdown of January’s mean temperature anomalies (mean temps are the average of max and min temps). South Australia +2.52°C Queensland +2.16°C Northern Territory +2.14°C Western Australia +2.13°C New South Wales* +2.02°C Victoria +1.71°C Tasmania +0.85°C *Note that the ACT is included as part of NSW as it has too few sites for a meaningful territory-wide average. In terms of rainfall, January was relatively dry compared to the long-term norm. Rainfall was 33% down on the long-term average nationwide, and was below-average in all states overall, although some pockets of some states got a heavier soaking than usual. Image: Cyclone Sean gave WA’s Pilbara coast considerably more January rainfall than usual, while the NSW coast was reasonably wet too, though thankfully not in the first week of the year when the men's cricket Test was on at the Sydney Cricket Ground. Source: BoM. When rainfall is below average, that generally means skies have been clear, which in turn tends to point towards warmer weather. So Australia's dryish January partly explains the exceptionally warm temperatures nationwide. But the underlying influence of climate change must also be taken into consideration, as illustrated in the graph below. Image: The warming trend is unmistakable. Source: BoM.
07 Mar 2023, 1:09AM UTC
Climate Update - Summer 2022-23
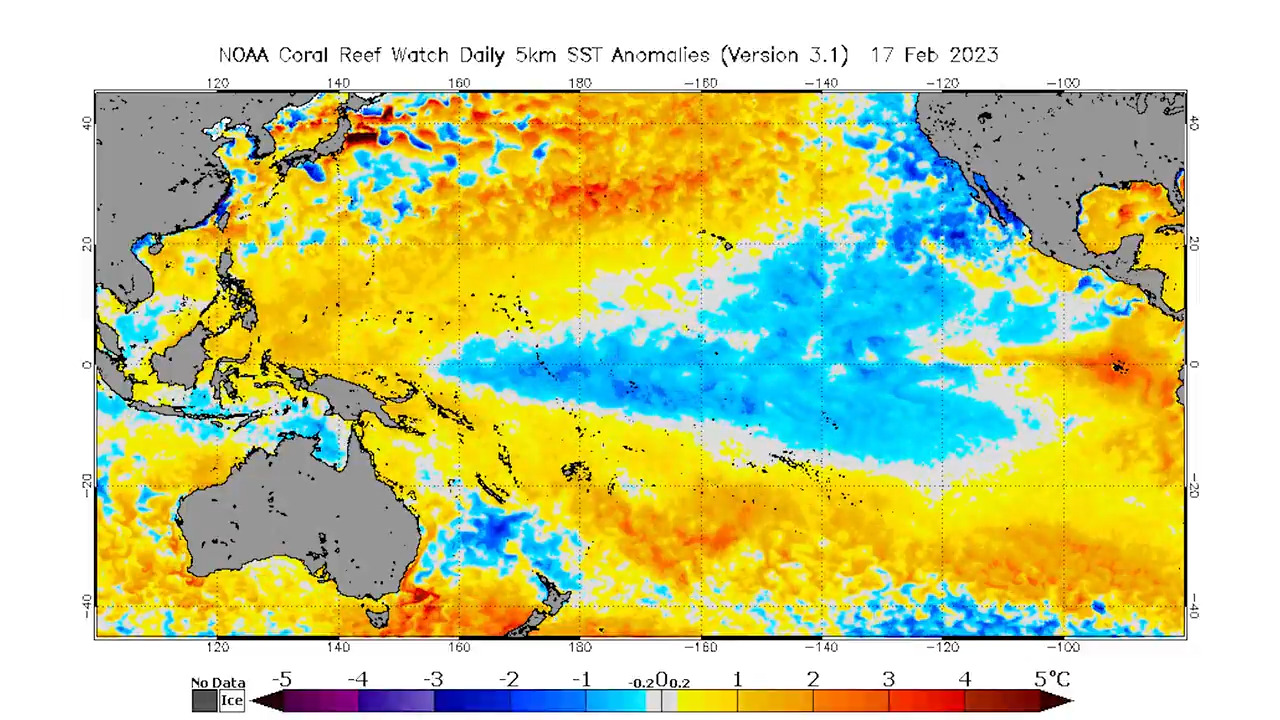
Australia just had one of its coolest and wettest summers of the last decade. However, there were clear signs that La Ni�a is finally losing its grip on Australia?s weather.
07 Dec 2022, 4:46AM UTC
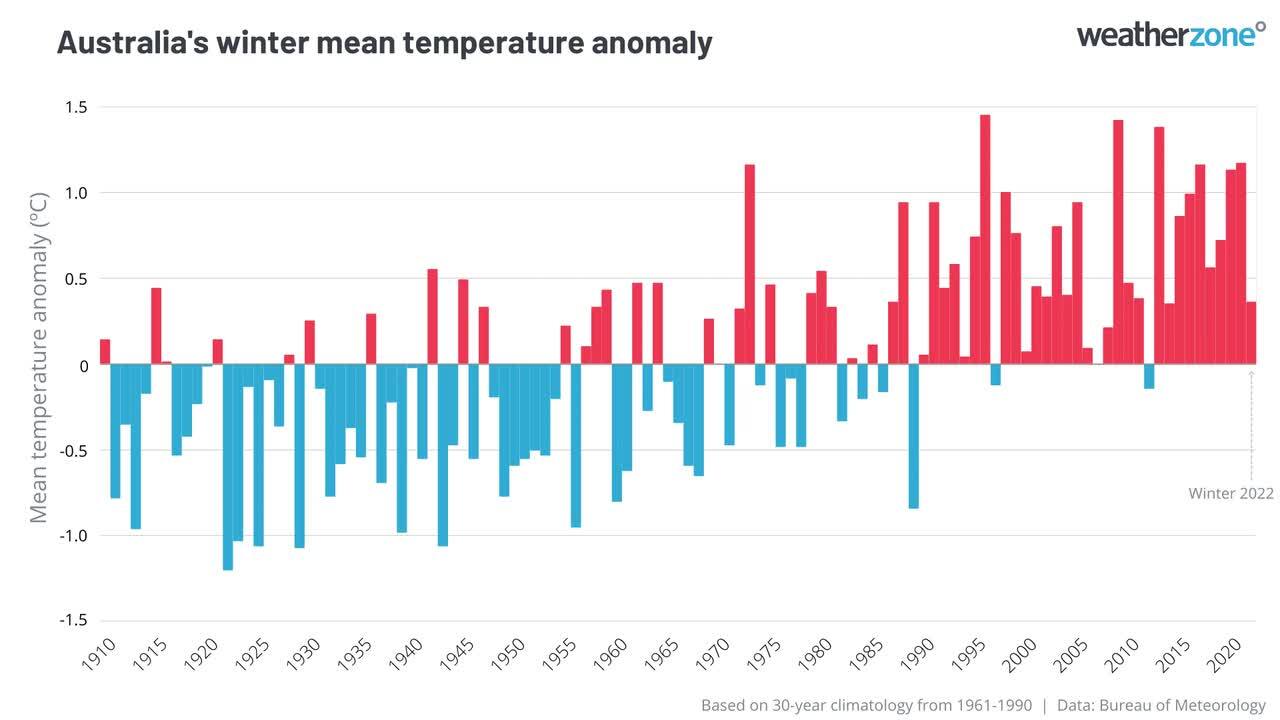
Climate Update Spring 2022
Australia just had its 2nd wettest spring on record and its coolest spring in more than a decade. But will this cool and wet weather continue over summer?
Extremes & Records
Live Extremes
Highest Temp
32.8°C (7:50PM AWST)
Apr Long Term Average: 33.8°C
Apr Record: 41.6°C (2016)
Lowest Temp
2.0°C (10:50PM AEDT)
Apr Long Term Average: 1.4°C
Apr Record: -7.2°C (2019)
Today’s Extremes
Highest Temp
40.5°C (2:39PM AWST)
APR Long Term Average: 28.9°C
APR Record: 40.1°C (2021)
Lowest Temp
-2.3°C (4:21AM AEDT)
APR Long Term Average: 1.4°C
APR Record: -7.2°C (2019)
This Month’s Extremes
Highest Temp
40.5°C (2 April)
Apr Long Term Average: 28.9°C
Apr Record: 40.1°C (2021)
Lowest Temp
-49.9°C (1 April)
Apr Long Term Average: 10.7°C
Apr Record: -1.2°C (2006)
This Year’s Extremes
Lowest Temp
-49.9°C (31 March)
JAN Long Term Average: 17.1°C
JAN Record: 6.1°C (1972)